Understanding how to analyze Amazon Best Sellers is one of the fastest and most reliable ways to identify high-demand products, spot market trends, and validate product ideas. Whether you are an Amazon seller, a Shopify store owner, or an eCommerce entrepreneur exploring new product opportunities, learning how to decode Amazon’s Best Sellers data can dramatically improve your product-research workflow.
This in-depth, step-by-step tutorial will walk you through everything you need to know—from reading BSR numbers and checking historical data, to evaluating competition, pricing, demand, and profitability. By the end, you’ll be able to independently research and validate winning products based on Amazon’s most trustworthy ranking system.
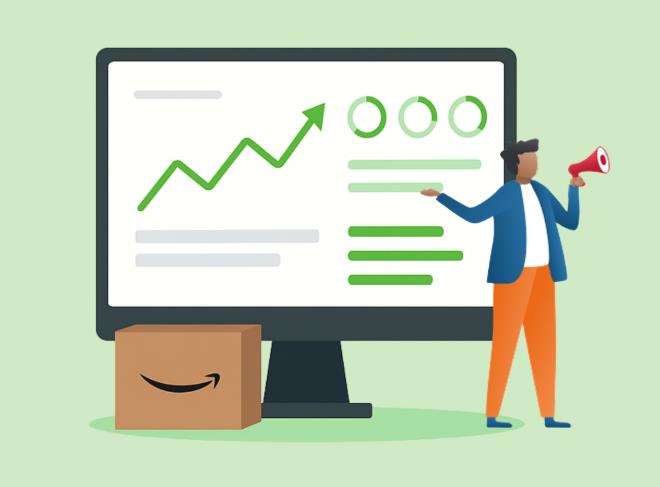
Why Amazon Best Sellers Matter
Amazon remains the largest online marketplace in the United States and Europe. Millions of listings are updated every hour, making Amazon’s Best Sellers list a real-time reflection of consumer behavior. Analyzing it correctly gives you:
- Insight into current buying trends
- Early discovery of emerging niches
- Validation for product demand
- Market-gap identification
- Competitor profiling
- Pricing and margin opportunities
For anyone working in eCommerce, Best Sellers data provides a massive shortcut to understanding what people want right now.
Understanding the Amazon Best Sellers Ranking (BSR)
Before diving into the step-by-step process, you must understand what Amazon’s Best Sellers Ranking actually measures.
What Is BSR?
BSR is a score assigned to every product in an Amazon category based on how well it has sold recently. A lower BSR means more sales.
- BSR #1 = Top-selling product
- BSR #50 = Strong seller
- BSR #5,000 = Mid-range seller (depends on category size)
- BSR #50,000+ = Low demand
BSR updates roughly every hour and is heavily influenced by recent sales velocity.
BSR Is Category-Specific
A product may have multiple BSR listings:
- One primary category
- Multiple subcategories
For product research, the main category BSR is the most meaningful because it represents broader sales volume.
Important Note: BSR Shows Sales Velocity, Not Profitability
A product selling extremely well may also:
- Have razor-thin margins
- Be dominated by big brands
- Require heavy advertising
- Have problematic logistics
That’s why Best Sellers analysis requires a multi-step validation process—not just chasing low BSR products.
Step-by-Step Amazon Best Sellers Analysis Tutorial
Below is the full workflow used by experienced product researchers, Amazon sellers, and Shopify dropshippers who rely on Amazon as a data source.
Step 1: Start With Amazon’s Best Sellers Page
Go to:
Amazon → Best Sellers → Choose a Main Category
Examples:
- Kitchen & Dining
- Beauty & Personal Care
- Tools & Home Improvement
- Pet Supplies
- Sports & Outdoors
Browsing subcategories is where you often find less competitive but still high-demand niches.
Tips for Choosing Categories
Pick categories with:
- Evergreen demand (Beauty, Kitchen, Pets, Sports)
- Simple product structures (low defect rate)
- Reasonable shipping size
- Low-brand loyalty (no dominant mega-brands)
Avoid:
- Electronics with complex components
- Seasonal-only items
- Products requiring certifications you don’t have
Step 2: Evaluate Demand Using BSR Ranges
You can quickly estimate demand levels by using general BSR benchmarks.
Category Benchmarks (General Guidance)
High demand
- Top 1–3,000 BSR in most main categories
Moderate demand
- BSR 3,000–15,000
Low demand
- BSR 15,000–80,000 (varies by category size)
How to Use This
If a product consistently stays below 10,000 BSR, it likely sells several units per day—enough to indicate healthy demand for research.
Step 3: Analyze Product Trend History
A product may be a temporary bestseller due to:
- Seasonal spikes
- Social media virality
- Recent promotions
- Short-term fads
To avoid launching products that will die in a month, check trend behavior:
Use Tools Like:
- Google Trends
- Keepa (best for BSR history)
- CamelCamelCamel
What to Look For:
- Stable BSR curve → consistent demand
- Sudden BSR spike → short-term trend
- Seasonal waves → good only during certain months
- Long-term upward trend → emerging niche opportunity
If the product has sold well for 6–12 months, it’s usually stable.
Step 4: Analyze Competition
Demand means nothing if competition is unbeatable. Examine:
Number of Competitors
Search the product keyword on Amazon.
Questions to ask:
- Are there too many similar listings?
- Do they all look identical?
- Is the category saturated with generic products?
Moderate competition is OK—oversaturation is not.
Brand Dominance
Check:
- Are big brands dominating the first page?
- Do they have higher review counts (2,000+ reviews)?
- Do they have Amazon’s Choice badges?
If yes, choose a different niche or find a differentiated version.
Image & Listing Quality
Poor listings = easy opportunity.
Look for:
- Low-quality photography
- Weak A+ content
- Bad bullet points
- Missing lifestyle images
If other sellers look sloppy, you can outperform them easily.
Step 5: Evaluate Reviews and Ratings
Reviews determine both trust and ranking power.
What You Want to See:
- Average rating below 4.3 → improvement opportunity
- Many listings with under 200–300 reviews → less competitive
- Repeated negative complaints → potential innovation angle
Red Flag Conditions:
- All top-ranked listings have 1,000+ reviews
- Ratings are consistently 4.7+
- No clear product defects to improve
This usually means the niche is mature and harder to enter.
Step 6: Evaluate Price Levels
Price is critical for profit and positioning.
Healthy Price Range
Most successful eCommerce sellers target:
- $15–$45 range (high impulse-buy rate)
- Cheap to ship
- Cheap to source
- Affordable for ads and scaling
Avoid Extremely Low Prices
Under $9 products have:
- Thin margins
- High return rates
- Little room for marketing costs
Avoid Extremely High Prices Without Expertise
Over $70 products usually require:
- Strong branding
- More complex logistics
- Higher trust
Step 7: Estimate Profit Margins
A product can have high demand but still be unprofitable.
You need to compare:
- Sourcing cost
- Shipping from supplier
- Amazon FBA fees (if applicable)
- Packaging
- Ad cost / CAC
- Miscellaneous fees
Look for:
- Minimum 30–40% profit margin
- After ads, still above 20–25% net margin
If margins are below 15%, skip the product.
Step 8: Identify Weaknesses and Market Gaps
This is where research turns into strategy.
Study customer reviews carefully:
Look for Negative Themes:
- Poor durability
- Missing accessories
- Bad instructions
- Leaking parts
- Confusing assembly
- Ugly packaging
Each complaint can be turned into a selling point:
- “Upgraded design improves durability”
- “Includes bonus accessories”
- “Eco-friendly materials”
- “Easy assembly with illustrated guide”
Improving weaknesses is the key to entering competitive niches.
Step 9: Analyze Product Variations
Sometimes you don’t need to sell the exact bestseller product. Instead, you can sell:
- A new color
- A bundle
- A premium version
- An accessory version
- A simpler version
- A kid-friendly or pet-friendly version
Understanding how variations impact demand helps you spot profitable sub-niches.
Step 10: Validate the Niche Using Multiple Best Sellers
Never rely on a single product.
Check:
- Are multiple listings in the niche ranking well?
- Does the page show more than 5–8 products under 15,000 BSR?
- Are there stable newcomers with low review counts ranking well?
If yes, the category is healthy and supports new entries.
Step 11: Check Seasonality
To confirm seasonality:
- Look at Keepa (BSR over a year)
- Check Google Trends
- Analyze search volume tools (Helium 10, Jungle Scout, etc.)
Evergreen Products
Examples:
- Kitchen tools
- Beauty items
- Office supplies
- Pet accessories
Highly Seasonal Products
- Outdoor gear
- Holiday decorations
- Sports equipment
- Heating/cooling devices
Seasonal products are not bad—they just require planning and inventory strategy.
Step 12: Check Legal, Compliance, and Safety Restrictions
Avoid products that require:
- FDA approval
- Certifications
- Hazardous materials handling
- Batteries and electronics testing
- Age-restricted components
Unless you have experience, compliance-heavy products increase risk.
Step 13: Confirm Logistics Feasibility
Ask:
- Is the product fragile?
- Is it oversized?
- Is it heavy to ship?
- Does it contain lithium batteries?
- Does it require custom packaging?
Ideal beginner-friendly products are:
- Small
- Lightweight
- Not fragile
- Low return risk
- Costs under $3–7 to produce
Step 14: Create Your Final Validation Checklist
Before selecting your final product, check:
✔ Demand is stable (BSR < 10,000)
✔ Multiple listings show strong demand
✔ Competition isn’t dominated by major brands
✔ Several listings have low reviews
✔ Clear negative review opportunities
✔ Healthy margin opportunities (25–40%)
✔ Simple logistics
✔ Not highly saturated
✔ Not overly seasonal
If a product passes the checklist with 80%+, it is ready for launch or further sourcing.
Case Study Example: Analyzing a Best Seller
Let’s walk through a hypothetical example of analyzing a stainless-steel water bottle (very common).
Findings:
- BSR for top listings: #200–#2,000 → Very high demand.
- Competition: Saturated with big brands (Hydro Flask, ThermoFlask, Iron Flask).
- Reviews: 10,000+ on top listings → Too competitive.
- Price: $20–$35 → Attractive but margins squeezed.
- Improvement opportunities: Minor.
- Verdict: Not a good product.
Alternative:
Look at sub-niches like:
- Kids stainless-steel bottles
- Mini travel bottles
- Sport bottles with special lids
- Dog travel water bottles
- Insulated food jar bottles
This is how you use Best Sellers to pivot into more profitable angles.
Advanced Tips for a Professional-Level Analysis
Here are additional techniques used by serious sellers:
Analyze Frequently Bought Together Products
This helps you find:
- Bundle ideas
- Complementary products
- Cross-selling opportunities
Analyze Product Dimensions
Shipping cost is heavily influenced by dimensions.
Small wins.
Track New Arrivals That Rank Quickly
Products with:
- Low reviews
- Rapid BSR rise
- Innovative features
…often indicate emerging trends.
Read Q&A Section
Customers reveal pain points Amazon sellers ignore.
Check FBA vs FBM Competitor Mix
FBM (merchant-fulfilled) listings may mean:
- Logistics are annoying
- FBA sellers are scarce
- Opportunity if you can do FBA efficiently
Amazon Best Sellers Analysis Done Right
Amazon Best Sellers provide one of the richest, real-time datasets for discovering what consumers want. But the key is not to chase products—it’s to analyze, validate, and strategically position yourself in the right niche.
By using the step-by-step framework in this tutorial, you can:
- Identify high-demand niches
- Spot weak competitors
- Validate product ideas accurately
- Build better product versions
- Create profitable eCommerce strategies
This is a method used by top sellers across Amazon, Shopify, Etsy, and even TikTok Shops. Best Sellers analysis is not just about finding what sells—it’s about understanding why it sells and how you can create something better.
Leave a Reply